


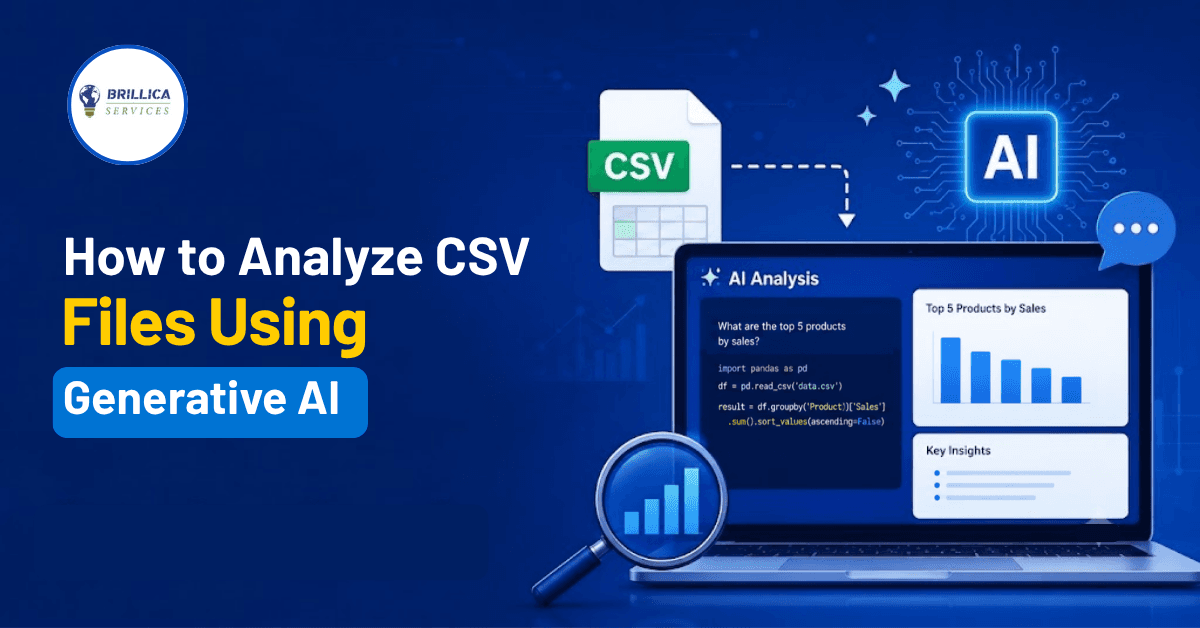
Have you ever opened a CSV file and found hundreds or thousands of rows that were difficult to understand? You are not alone. CSV files are widely used for storing sales records, customer data, website traffic, survey results, and many other types of information. The good news is that Generative AI can make CSV data analysis faster and easier, even if you are a beginner.
In this guide, you will learn how to analyze CSV files using Generative AI, find useful patterns, generate insights, create Python code, and perform basic Exploratory Data Analysis (EDA). We will also look at tools such as PandasAI and Quadratic.ai and explain how beginners and business owners can use AI for data analysis.
What Is CSV Data Analysis?
CSV stands for Comma-Separated Values. It is a simple file format used to store information in rows and columns. For example, an online store may have a CSV file containing customer names, product names, sales amounts, dates, locations, and order status.
CSV data analysis means examining this information to find useful facts and patterns. You may want to know which product sells the most, which month has the highest sales, which customers buy frequently, or whether sales are increasing over time.
Traditionally, analysts use tools such as Excel, SQL, and Python with Pandas to answer these questions. Today, Generative AI for data analysis can help users ask questions in normal language and receive explanations, analysis steps, or code.
What Is Generative AI for Data Analysis?
Generative AI can understand natural-language instructions and help users work with data. Instead of writing every command manually, you can describe what you want to know.
For example, instead of writing Python code to calculate average sales, you could ask:
"What is the average sales value in this dataset?"
Depending on the tool you use, AI may generate the calculation, explain the result, create Python code, or help build a chart.
This makes AI-powered data analysis useful for students, beginners, and business owners who want to explore data without spending hours writing code.
However, AI should be treated as an assistant rather than the final decision-maker. Always check the generated calculations, assumptions, and conclusions before using them in business reports.
Why Analyze CSV Files Using AI?
There are several reasons to use AI for CSV analysis.
1. Saves Time
AI can help automate repetitive tasks such as summarizing columns, finding missing values, calculating statistics, and identifying patterns. This can reduce the amount of manual work required for basic analysis.
2. Easy for Beginners
You do not always need advanced Python or SQL knowledge to start asking questions about a dataset. Natural-language prompts can make data exploration easier for beginners.
3. Helps Generate Python Code
Some AI data analysis tools can create Python code based on your instructions. This is useful for students who want to learn how professional data analysis tasks are performed.
4. Helps Find Patterns
AI can help you explore trends, relationships, unusual values, and other patterns that may not be immediately obvious when looking at a spreadsheet.
5. Supports Faster Exploratory Data Analysis
EDA is usually the first step in understanding a dataset. AI can help with common EDA tasks such as checking data types, summarizing columns, finding missing values, and exploring relationships between variables.
How to Analyze CSV Files Using Generative AI
The exact process depends on the AI tool, but the overall workflow is simple.
Step 1: Prepare Your CSV File
Before uploading your file, check that the data is reasonably clean.
Make sure:
Column names are clear
Important values are not missing unnecessarily
Dates use a consistent format
Numbers are stored as numbers
Duplicate records are identified
Sensitive information is removed when possible
For example, if you have a sales CSV file, your columns might include:
Date | Product | Category | Quantity | Sales | Region |
2026-01-05 | Laptop | Electronics | 2 | 120000 | Delhi |
2026-01-08 | Mouse | Accessories | 10 | 15000 | Dehradun |
2026-01-12 | Keyboard | Accessories | 5 | 20000 | Delhi |
A clean dataset makes analysis easier and reduces the chance of incorrect results.
Step 2: Choose an AI CSV Analyzer
The next step is to choose an AI CSV analyzer or another AI data analysis tool.
Depending on your needs, you can explore tools that support natural-language questions, Python code generation, spreadsheet analysis, or DataFrame-based workflows.
Popular options include:
PandasAI
Other AI tools that support CSV or tabular data analysis
Always check the current features, pricing, file limits, and privacy terms of a tool before uploading business or personal data.
Step 3: Upload or Load the CSV
Upload your CSV file into the selected tool.
For example, Quadratic supports importing CSV files and can work with Python and DataFrames inside its spreadsheet environment. Its documentation also shows that CSV files can be dragged into the spreadsheet and used with Python-based analysis.
Once the data is available, you can start exploring it.
Step 4: Ask Questions in Natural Language
This is where Generative AI becomes especially useful.
Instead of starting with complex code, ask clear questions about your dataset.
For example:
"How many rows and columns are in this dataset?"
"Which product has the highest sales?"
"What is the average order value?"
"Show me the top five products by revenue."
"Are there missing values?"
"Find unusual values in the sales column."
"Which region generated the most revenue?"
"Show the monthly sales trend."
"Create a chart showing sales by category."
Good prompts should clearly mention what you want the AI to calculate, compare, filter, or visualize.
How to Use PandasAI to Analyze CSV Files
PandasAI data analysis is designed to make interaction with Pandas DataFrames easier through natural-language instructions.
A typical workflow involves loading a CSV file into a Pandas DataFrame and then using an AI-powered interface to ask questions about that DataFrame.
For example, you could ask:
"What are the top five products by total sales?"
Or:
"Find the average sales for each region."
The tool can help translate these questions into data-analysis operations and, depending on the setup and version, provide results or generated Python code.
This approach is particularly useful for students learning Python because you can compare your natural-language request with the Python logic used to answer it.
Example PandasAI Workflow
A basic workflow looks like this:
CSV file → Pandas DataFrame → AI prompt → Analysis → Result or Python code
For example:
Load sales.csv
Create a Pandas DataFrame
Connect the DataFrame with your AI analysis workflow
Ask a question
Review the generated result
Check the code and calculation
Use the result in your report or dashboard
This is a practical way to learn both PandasAI CSV analysis and traditional Python data analysis.
How to Use Quadratic.ai for CSV Data Analysis
Quadratic is an AI-enabled spreadsheet that combines spreadsheet features with tools such as Python, SQL, JavaScript, and AI. Its AI Chat allows users to ask questions in natural language, while its Python environment can work with DataFrames and return results to the spreadsheet.
A simple Quadratic.ai CSV analysis workflow can look like this:
Open a new Quadratic spreadsheet.
Drag and drop your CSV file.
Review the imported data.
Open the AI Chat.
Ask a question about your dataset.
Review the generated analysis or code.
Check the result.
Create charts or additional analysis when needed.
Quadratic's documentation shows that its AI can generate analysis from the data in a sheet and insert the generated code into the spreadsheet. It also supports Python-based calculations, DataFrames, and visualizations.
For example, you could ask:
"Find the top five regions by total sales and create a bar chart."
The important advantage is that you can inspect the generated work rather than relying only on a final number.
How to Perform EDA Using AI
Exploratory Data Analysis, or EDA, is the process of understanding a dataset before deeper analysis or machine learning.
When using AI for exploratory data analysis, you can ask AI to help with several common tasks.
1. Understand the Dataset
Start with basic questions:
How many rows are present?
What columns are available?
What type of data does each column contain?
Which columns are numeric?
Which columns contain categories?
2. Find Missing Values
Ask:
"Find all columns with missing values and show the percentage of missing data."
This can quickly highlight areas that need cleaning.
3. Find Duplicate Records
Ask:
"Check this dataset for duplicate rows and report the number of duplicates."
Duplicate records can affect totals and other calculations.
4. Generate Summary Statistics
Ask AI to calculate:
Mean
Median
Minimum
Maximum
Standard deviation
Count
Unique values
These statistics help you understand the basic shape of your data.
5. Find Trends and Relationships
Once the basic checks are complete, ask questions such as:
"Is there a relationship between advertising spend and sales?"
or:
"Which category has grown the fastest over time?"
The AI may help you calculate the required values and suggest suitable charts.
Useful AI Prompts for CSV Analysis
The quality of your result often depends on how clearly you ask your question.
Here are some useful prompts:
For basic analysis:
"Analyze this CSV and give me a simple summary of the important columns."
For data cleaning:
"Find missing values, duplicate rows, and unusual values in this dataset."
For sales analysis:
"Find the top 10 products by total sales and show their percentage of overall sales."
For customer analysis:
"Identify the customer segments with the highest average order value."
For visualization:
"Create a suitable chart showing monthly sales trends and explain the main pattern."
For Python learning:
"Generate Python Pandas code to calculate the average sales by region and explain each line."
These prompts can help students learn while also helping business owners get quick answers from their data.
Benefits of Automated CSV Analysis
Automated CSV analysis can be helpful when you regularly work with similar datasets.
Some key benefits include:
Faster initial data exploration
Less repetitive manual work
Easier access to basic insights
Natural-language interaction
Faster Python code generation
Support for charts and visual analysis
Useful learning support for beginners
However, automation does not remove the need for human review. A generated result can be wrong if the dataset is poorly structured, the prompt is unclear, or the AI misunderstands the business question.
Important Things to Check Before Trusting AI Results
AI can make data analysis easier, but you should not blindly accept every answer.
Check the Data
Make sure the AI is using the correct columns and records.
Check the Calculation
If possible, verify important numbers using Excel, SQL, Python, or another trusted method.
Check the Prompt
A vague question can produce a vague answer. Give the AI clear instructions.
Protect Sensitive Data
Do not upload confidential customer information, passwords, financial records, or other sensitive business data to an AI service unless you have confirmed that the tool is appropriate and your organization's policies allow it.
Review Generated Code
If AI generates Python or SQL, read and test the code before using it in production.
AI vs Traditional CSV Analysis
Generative AI does not replace traditional data-analysis skills. Instead, it can work alongside them.
For example, a beginner can use AI to understand Pandas code, while an experienced analyst can use AI to speed up repetitive tasks.
A strong workflow is:
AI prompt → generated analysis/code → human review → validation → final insight
This approach gives you the speed of AI while keeping human judgment in the process.
Who Can Benefit from AI CSV Analysis?
Students
Students can use AI to practice Python, Pandas, EDA, data visualization, and analytical thinking. Asking AI to explain generated code line by line can also make difficult topics easier to understand.
Beginners
People who are new to data analysis can use natural-language prompts to understand datasets before learning more advanced programming techniques.
Business Owners
Business owners can use AI tools for data analysis to explore sales, customers, marketing performance, inventory, and other business data. However, important business decisions should be based on verified numbers rather than an AI response alone.
Final Thoughts
Learning how to analyze CSV files using Generative AI can make the first stages of data analysis much easier. You can upload a dataset, ask questions in simple language, explore patterns, generate Python code, and create useful visualizations without doing every step manually.
Tools such as PandasAI and Quadratic.ai show how natural-language interaction can be combined with Python, DataFrames, spreadsheets, and data visualization. Quadratic, for example, allows users to work with CSV data, Python, AI-generated code, and charts in the same environment.
But remember: AI is a helper, not a replacement for data-analysis knowledge. Learn how the calculations work, check important results, protect your data, and use AI-generated code carefully. If you want to build practical skills in Generative AI and data analysis, Brillica Services provides best Generative AI Classes with practical learning designed to help students and beginners understand real-world AI applications.
Start with a small CSV file, ask simple questions, verify the answers, and gradually move toward more advanced analysis. That is one of the easiest ways to build confidence with AI-powered data analysis.